
Root Cause Analysis and Improvements on OTC Network Outage 2017-11-08
About this document
The Open Telekom Cloud(OTC) had a broad network outage on 2017-11-08 from 13:44 CET until 14:41 CET. The OTC customers were informed about it an hour after the event and some details on what exactly happened were sent out in the morning of 2017-11-10.
This document summarizes the findings and improvements that have taken place since the event occurred and goes into details how this could have happened and what has been done to prevent similar trouble in the future.
It also describes the impact that this had to our customers.
The OTC team would like to apologize for the trouble this has caused to our customers! We have been working hard to earn the trust of our customers. We want to share the details of the analysis and improvements to provide transparency into the hard work giving our customers the ability to understand what happened and to judge themselves whether we have effectively addressed the problems.
News since last email notification on 2017-11-10
If you have read the previous detailed explanations of the trouble before, you do have a rough picture. If you would like to only get a brief update, here is a very short summary of the news:
- The trigger is well understood now. The NetStream devices are connected to two switch ports each. They have the unfortunate property of replicating packets across the ports, thus taking the role of a L2 bridge. The Spanning Tree Protocol (STP) kept the L2 network loop from causing any trouble. Relying on STP here was unintended and we were unaware of it.
- A (planned) config change to a core switch triggered a firmware bug that caused STP to fail. The previously blocked second NetStream port went into forwarding state thus creating an L2 network loop. The next broadcast packet coming in then resulted in packet explosion.
- The NetStream cards continue to receive replicated packets (monitoring), but the L2 connection to them has been disabled; the switch has now a Layer 3 connection configured for the NetStream ports, preventing (L2) broadcasts from being propagated. In addition, VLAN 1 is no longer configured on the link between the core switches of the two availability zones.
- A firmware update (fixing the STP failure) has been deployed.
- Enabling of the broadcast storm mitigation feature of the core switches has been prepared. (We intend to enable it later this week.) We also plan to configure alarms that trigger when broadcast packets get dropped due to the broadcast limitation.
- By design, we do no longer rely on STP to keep us safe from L2 network loops; we never intended to. At this point STP has not been disabled on the core switches -- we instead plan configuring alarms in case a core switch sets a port into blocking state due to STP. The experts are still in discussion whether it's safer to completely disable STP or to leave it enabled with alarms.
Detailed analysis
Sequence of events
After the alarms displayed failures on the platform to the operations team, the engineering team quickly validated that the failures were broad and escalated the issue. The operations team created a “war room” setup, where key operators, management as well as employees from our platform partner Huawei gathered in a virtual room where all the actions for analysis, mitigation, corrections and communication were gathered.
It was rather quickly determined that the issue was caused by networking trouble. While the admin plane is well separated and admin access to all hardware was unaffected, it was suspected that the internet connectivity for customers was failing. A few tests later it became clear that while this connection was degraded in performance, the real issue was the connection to the services in the provider network (100.64/10). This network hosts the API gateway and other internal services that are provided to the VMs such as the local DNS service, NTP and repository mirrors. The machines behind those services were confirmed to work fine, just network access for customers was impossible.
Next was the investigation of the core switch and the suspicion of a switch chassis failure was investigated and ruled out. A detailed analysis of the traffic on the switch finally revealed that there was a storm of broadcast packets that caused overload on connected systems. The storm was determined to involve the interswitch connection and two ports with EIP monitoring devices (NetStream cards) connected. Disabling these two ports caused the system to function normally very quickly again.
The war room setup was continued for another day to fully analyze the issue and drive improvement actions.
The EIP traffic monitoring service was reestablished after the first version of a root cause analysis was published and reviewed internally during the night and a change that separates and reenables the monitoring service was approved and performed in the early morning of Thu, 2017-11-09. After that the first report to our customers was published and more investigations on improvement actions were performed, most of which are completed by now.
Analysis
Two ports on each core switch connect to a “NetStream” card, which analyzes traffic for monitoring the traffic of external IP addresses. These cards only consume data, so beyond network management traffic (ARP requests) they should not cause any outgoing traffic. And they did not until 2017-11-08 13:43 CET.
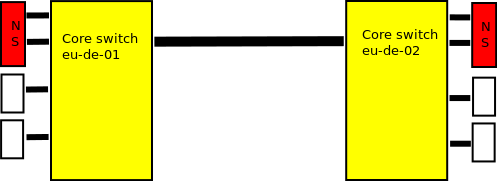
What the team was unaware of is that the cards replicate the traffic between the two ports, thus effectively acting as a network bridge device between the two ports, resulting in a L2 network loop. This would cause trouble with broadcast storms in normal operations if the Spanning Tree Protocol (STP) would not prevent it. The core switch had correctly detected the loop and set one of the ports to blocking.
This is normal and perfectly fine STP behavior -- allowing network topology with redundant L2 paths to network segments for redundancy. However, the reliance on STP was unintentional here -- in general we separate the network into many different VLANs and use link aggregation for redundancy rather than STP controlled L2 failover.
At 13:43 CET a planned change was performed on one of the core switches, configuring a super-VLAN (with many subordinate sub-VLANs) to enable access for a DirectConnect customer to all his networks.
We run the switches with logging enabled, so we can debug issues after they occurred. Due to a bug in the switch firmware the logging of all the affected sub-VLANs was serialized with the processing the BPDUs, the packets that are used to make STP work. This caused a BPDU processing timeout -- 30s later, the second NetStream port went into forwarding state. The next broadcast packet on the default VLAN 1 caused the broadcast storm to emerge.
The core switches noted this by repeated MAC address flapping between ports, which then also caused the alarm to be raised. While the core switch was unimpressed by the broadcast storm, other devices (e.g. firewalls) were overloaded by this broadcast load, resulting in a huge packet loss rate. This finally resulted in a number of network connections to be very slow or even completely fail.
Root cause
Let's summarize the above findings and look at the problems that came together to result in the issue:
- The NetStream cards formed unintended L2 network loops, only prevented by the core switch using STP and setting one port into blocking state.
- The default VLAN ID 1 was not disabled everywhere where it could and should have been disabled. This allowed the broadcast escalation in the NetStream cards to also reach the other availability zone and affect more network segments than it should have.
- The serialization caused by logging of a large number of sub-VLAN IDs when configuring the super-VLAN triggered STP in the core switches to fail. This failure is considered a bug in the core switch firmware which the vendor Huawei accepted (and fixed meanwhile).
Fix
The immediate reaction of the Operations war room team after observing the broadcast storm was to disable the NetStream ports. This immediately stopped the storm and the system went back to normal within seconds. The side effect was however that no more monitoring data was fed to CloudEye for monitoring of traffic from EIPs.
After the problem was understood better, the VLAN configuration was changed to no longer have the VLAN 1 configured between the core switches and to the NetStream cards. In addition, the NetStream ports were set to L3 mode on the core switch. This prevents broadcasts from the NetStream cards from being transmitted -- a L3 connection (router) limits a broadcast domain. The packets sent to the ports via the switch monitoring setup are not affected. After this was tested and determined to be safe, the NetStream ports were reenabled on the morning of 2017-11-09.
More fixes have been implemented, see below for further Improvements.
Further improvements
While the VLAN setup and the change to use L3 connections to the NetStream card now establishes safety against broadcast loops with the NetStream cards and thus ensures operational safety again, the team is using the opportunity to also increase the safety against hypothetical other malfunctions as well. The following actions have been performed:
- Comprehensively reviewing the VLAN setup for other unnecessary usage of default VLAN IDs on the core switches. This was completed quickly.
- Same review of the all the other switches of the infrastructure. For this review, our supplier actually provided a small tool to automate this rather than relying on manual review. We have many switches ... At the time of writing, this has been completed on all switches.
- Review the actual configuration of all other VLAN ID usage to match the separation that is part of the low-level design of the setup. Automation tooling is used here as well. As there are many VLANs in use, this is still ongoing.
- Configuring broadcast storm control/mitigation on the switch to prevent overload on connected devices. We also look into possibilities to trigger alarms when the switch ever has to drop broadcasts because of this setting. We are in the final steps to perform tests and review the runbook for this change -- we expect to carry this out before the end of the week.
- A firmware fix has been developed by Huawei, tested and deployed to the core switches earlier this week. We have validated that it works in our reference environment: STP should never fail again due to configuring a super-VLAN with many sub-VLANs.
- We never intended to rely on STP to keep us safe from network loops. A comprehensive review of the network setup has been done and we have not found any other loops except for the storage cluster where we indeed use it intentionally. We have currently left STP enabled on all the switches, but are now looking into configuring alarms if a port goes into blocking state due to STP. This allows us to never overlook again an unintended network loop. We are currently discussing whether completely switching off STP would be a safer choice or not.
- We review the escalation process and the used monitoring tools: We wonder what we could have done to more quickly understand the cause of the network storm. We are also looking into improving the list of standard things to check in case of an outage and into ways of collecting the information more efficiently and quickly. Firedrills are performed for the humans participating in the process. Communication in the team was working well, but we are looking into ways to also speed up the communication process to outside stakeholders.
Customer impact
We would like to mention that the infrastructure did not lose any VMs or any data on the storage devices due to the network trouble, nor were any unintended or unauthorized operations performed or made possible. The integrity of the platform was and is unaffected by the network outage.
Nevertheless we consider our first outage this year as severe. It
affected both availability zones in our eu-de{.docutils .literal}
region, thus also affecting the customer setups that are normally very
safe by having been properly configured to deal with one availability
zone going down.
Customer setups in OTC were affected in four ways:
-
Any cloud automation that relied on doing any control plane operations (configuration changes or resource creation/modification/deletion via API) would fail during the period of 13:44 -- 14:41 CET on 2017-11-08. No auto-scaling, no VM creation, no networking changes ... could happen during the time, not even status requests (GET) went through. Customers manually looking at the Web Interface also did observe empty setups. Poorly written cloud automation tools might crash or have a distorted view of reality, potentially causing resource leaks. Most cloud automation tools fortunately deal with this more gracefully; we are not aware of customers that had serious challenges with these kinds of problems.
-
NTP, DNS and repository servers in our public service zone (100.125/16 network) were unreachable for VMs. In our subnet configuration, we have set the internal name server (actually a cluster) at 100.125.4.25 as primary DNS server and the external google DNS server as secondary server. Customers that used this setup will have had very slow DNS resolution in their VMs on OTC. (It can take several seconds until the DNS request to the first name server times out and the secondary one is consulted.) This effect has contributed to some services looking unresponsive.
-
The network performance degradation between VMs on the OTC and to the internet was serious. For some customer applications it appeared as a complete loss of network connectivity. While the VMs continued to run (as was confirmed by the author having uninterrupted though slow ssh access to his VMs and having the ability to access the static web pages hosted by VMs behind an ELB), their usefulness during the network outage may have been severely hampered. Most customers reported that their application did recover without manual intervention just fine after the network started working well again.
However there may be applications that don't recover well after an hour of very bad network performance. If for example too many requests have queued up somewhere, the application may suffer under higher load after recovery. And not every application handles this gracefully. We did investigate a suspected short outage twelve minutes after the recovery with a customer and found out that the issue was at application layer (which then also recovered itself shortly after) and OTC was not the reason for this short secondary application outage. This is in accordance with our own monitoring systems which did not show any trouble after 14:41 CET.
-
We are aware of one customer that had written automation that consumed the monitoring data on external IP address (EIP) traffic from Cloud Eye -- the data only became available again on 2017-11-09 at 06:04 CET when we reenabled the NetStream cards.
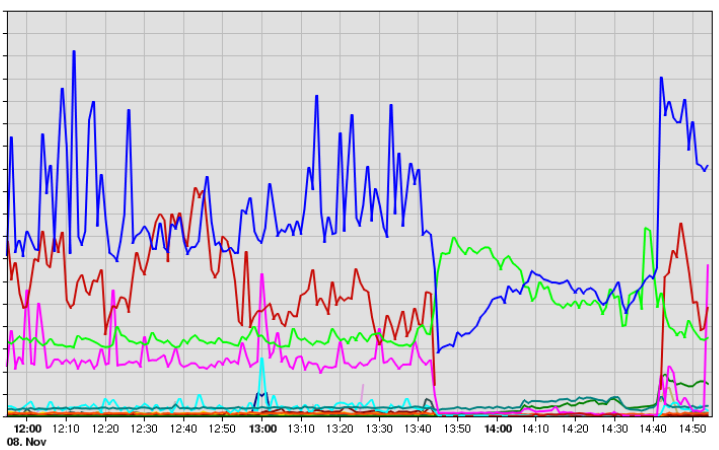
The result of the network trouble is very visible in many of our monitoring systems. The graph to the right shows the inbound traffic from the internet into OTC by protocol on Nov 8 (times in CET). The blue line is for https (or more precisely port 443) traffic, the other colors denote traffic to other ports. The performance degradation is clearly visible.
We have had contact with a number of customers following the outage and have supported by answering questions or -- if requested -- in a few cases with the investigation of issues. Please reach out if you have still questions or are looking for support.
FAQ
Can this happen again?
A very similar issue is extremely unlikely. With the change of NetStream card config to layer 3, the VLAN review and changes, the L2 loop avoidance with STP blocking monitoring, the broadcast storm mitigation, and the switch firmware fix, we are very safe against similar issues. Actually with all the networking improvements performed, we have a networking setup that has several protection layers against many classes of possible failures.
Would another Availability Zone help?
While spreading resources over two or more AZs helps a lot and is best practice on public clouds to achieve high availability, this event was one of the few, where it did not help to mitigate the problem. The reason is that the broadcast storm was transferred over our high-bandwidth low-latency DWDM connection between the two data centers.
What can I do to make my application more resilient?
Most issues that could potentially occur in our cloud environment would only affect one availability zone (AZ). Only due to a configuration mistake (leaving VLAN ID 1 enabled) and all the other circumstances could this issue affect both. As mentioned above, there are now several layers of protection against any similar issue, so we consider a similar issue extremely unlikely. Customers that have set up their cloud application such that they can cope with a single AZ to fail can still expect to see availabilities above 99.95%.
For even higher availability, a multi-region setup or even a multi-cloud
setup can be implemented. Multi-region is possible with our Singpore
(ap-sg{.docutils .literal}) region.
Acknowledgments
When the issue occurred, the T-Systems' Operations team was quickly pulling the war room team together to react. We also got our partner Huawei aboard very quickly to support the investigation. The collaboration was open, helpful and very effective.
The engineers exposed a spirit to dig into this until every relevant detail was fully understood and there were really good discussions on what the best improvements would be. A significant number of them was identified and even more were (and still are) discussed between the experts. Decisions were taken and implemented with diligence.
The author would like to thank the team for the hard work!
We would also like to apologize again to you, our customers and thank you for your understanding -- we are very aware that this outage caused trouble to you and that we failed to deliver to our own and your expectations that day. We have learned a lot and shared the learnings with you. We hope you continue to work with us.