
Root Cause Analysis and Improvements on OTC Outage 2019-03-30
The Open Telekom Cloud (OTC) suffered a full outage from 2019-03-30 from 12:10 CET until 2019-03-31 14:58 CEST. OTC customers were informed an hour after the event. A preliminary report was sent out in the evening of 2018-04-02. Read in this blog post a detailed analysis and a summary on the technical improvements.
About this document
This document summarizes the findings and improvements since the event occurred. It also details the root cause as well as measures, preventing similar events in the future. Furthermore, this document describes the impact the incident had on customers.
The OTC team apologizes for the inconvenience this incident caused to our customers. The OTC is well aware that trust is the cornerstone of customer satisfaction for a platform, and is working hard to meet those expectations. The OTC outage on 2019-03-30 damaged the trust we have gained so far. We share this analysis to win it back. We thoroughly analyzed the outage and its root cause, we clearly identified the issues and we are confident that we have set up the right measures to prevent a similar outage in the future.
Detailed analysis
Sequence of events
The internal monitoring systems detected first abnormal operations on 2019-03-30, 12:10 CET (Central European Time). The monitoring systems showed an increasing CPU-utilization on many storage nodes (EVS = Elastic Volume Service). The load increase spread quickly over all availability zones and regions: In less than 5 minutes all monitored nodes reported nearly 100% CPU utilization. As a consequence, the storage network utilization also went up to a congestion that prevented ssh access to mitigate the overload.
The root cause was a bug in a monitoring algorithm calculating rescheduling times of a Unix cron not properly considering upcoming daylight-saving time change in Germany. The miscalculation continuously scheduled tasks for the past, resulting in a storm of nearly continuously and permanently running jobs on all CPUs. Finally, running monitoring jobs consumed all available CPU capacity on all nodes. This was specifically critical on storage nodes, because these nodes run a regular health check. If this health check fails, storage nodes will be detached from a storage cluster to not compromise the whole cluster, if only a few storage nodes fail. The case of all storage nodes failing due to high CPU utilization is one of the less probably scenarios and thus was not sufficiently backed up by additional mitigation measures. All storage clusters became unavailable. This in turn initiated a massive amount of reconnects from virtual machines trying to reach their attached (but not available) storage, leading additionally to an extremely high network utilization on the internal storage backbone.
Since the monitoring software affected by the bug is a core platform component deployed on all hosts on the OTC, this incident affected all availability zones.
Only minutes after the first monitoring alarms, the engineering team quickly validated that the failures were widespread and escalated the issue. At 12:15 CET, the operations team switched to "war room" setup, where key operators, management and employees from our platform partner Huawei gathered jointly steering all actions of analysis, mitigation, correction and communication. At 12:40 CET, the investigation was broken down into 10 different workstreams, investigating the issue in parallel. At first, the teams had difficulties to access the platform as the network was highly utilized, even for the management zone. That was also the reason why the team at first suspected a network issue. However, thanks to a secondary monitoring system, which still delivered reliable data, it became clear that the root cause was not within the networking domain.
At 15:45 CET, when the root cause of the incident was still unconfirmed, a full layer check was initiated (based on OSI/ISO Layer model). Unfortunately, it took until 18:30 CET to identify the monitoring agent as the cause of the issue.
Having the root cause at hand, the team regained full control over the situation. At 20:20 CET, major OTC services and OTC console were back online (except DNS, KMS, SFS, CSS, TMS, WAF, OBS, WS, CE, AS). The remaining services were recovered step by step: at 22:00 CET AS, at 22:50 CET KMS, SFS, CSS, TMS,WS, CE, on 2019-03-31 at [01:30 CET] WAF, at 02:30 CET OBS and finally at 03:03 CEST DNS.
From then on, the team ran intensive quality tests to safe-guard that the fix was successfully applied to the platform. In parallel, the team worked closely with many customers, who were facing difficulties to get their services back online due to problems related to the storage outage.
At 2019-03-31, 14:00 CEST, most of the applications of our platform customers were fully restored for end-customers.
Analysis
OTC platform monitoring uses two distinct monitoring systems that work independently from each other. The primary monitoring system is an adapted version of Zabbix, the secondary monitoring system is an unmodified version of Telegraf with Grafana dashboards. The objective of having two independent systems is to provide fail-over capabilities: if one monitoring system fails, the other monitoring system might still be able to gather meaningful insights, which can be used for troubleshooting and other purposes. In the case of the outage on 2019-03-30, the Zabbix-based monitoring systems failed due to a software bug and caused the issue, while the other system was still working. In this specific case, the failure of an observation tool impacted the operational behavior of the platform in an unforeseen large dimension: the congestion of the whole platform.
Both monitoring systems require agents deployed on all nodes of the platform. At first sight this is a sensible decision for two reasons:
- All nodes shall be monitored equally to get a full overview of the status of the platform at any time and to detect malfunctions quickly.
- The platform compliance and security can only be efficiently ensured with a high degree of standardization of the nodes' setup, including their monitoring.
At second sight, the incident has proven that even a monitoring system can become a single point of failure, rendering all resiliency mechanisms implemented in the platform invalid.
Apart from more fine-grained utilization monitoring, monitoring agents of the primary monitoring system collect general node information (eg. CPU status, memory status, OS version, base management controller version, network information and serial number of the physical host) on every node every 12 hours using lspci (see wikipedia) command. The results are reported to a central logging entity as one of many means to identify noncompliance with a node management database.
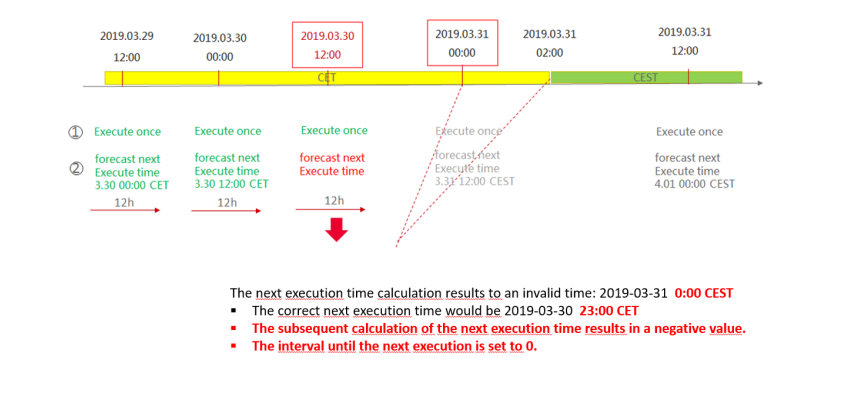
To calculate the next execution of the lspci command (that means 12 hours after the current execution), every day at 0:00 and 12:00 the primary monitoring systems calculate the next execution time based on the current time plus 12 hours. On 2019-03-30, 12:00 CET, when this calculation was executed, the calculation returned a negative value. The reason for this was that the code used at this point, a function call to time_t cron_next(cron_expr* expr, time_t date) as defined in ccronexpr.h of the open source library "Cron expression parsing in ANSI C" was not time-zone aware. The reasons is that the library had been compiled without the c-compiler flag -DCRON_USE_LOCAL_TIME, which enables local dates (current system timezone) instead of GMT. The negative result was checked, but was set to 0 on case of negative result. Subsequently, a zero-interval was used to define the next cron execution time for the lspci command. This not only triggered the immediate execution of lspci command, but also triggered the restart of the whole process of re-calculation of the next execution time, setting again 'now' as the next cron execution time and so forth. In this part of the service, no congestion avoidance measure prohibited spinning up more and more lspci processes, thus not preventing full CPU usage on one given node.
The following figure shows, how the issue was triggered:
The following figure shows an example host during 2019-03-30 and 2019-03-31. As the number of processes increases, the CPU utilization (in %) increases quickly and recovers after the faulty monitoring agents had been disabled.
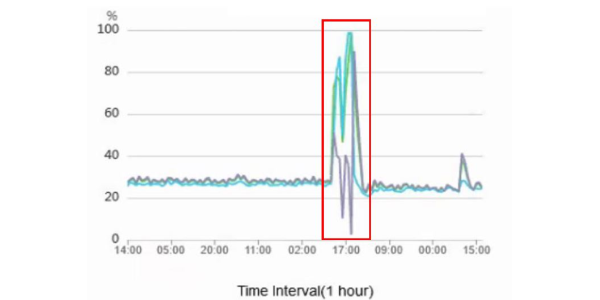
As a secondary effect, the exhausted CPU resources on many nodes led to a heartbeat failure for the storage pools. Virtual machines relying on their storage clusters started to flood the network with un-answered storage requests, congesting finally also the network.
Root cause summary
To summarize the above findings: The root cause was a software bug in cron management related to the shift to summer time.
Mechanism:
- A library function is called by the monitoring agent on each machine to create a time forecast when to check the machine status next.
- The day before the time shift situation CET->CEST this function is returning a forecast value from the past.
- This triggers cron to start numerous monitoring jobs in parallel, overloading the system information interface of the kernel and driving the CPU utilization into saturation.
Impact:
- On the storage cluster nodes, a subsequent automatic health check detects an abnormal high utilization and suspends the node from the cluster.
- Performance of the cluster drops rapidly as resources disappear with the unavailability of the service at last.
- Virtual Machines relying on their storage clusters flood the network with storage requests which are not getting answered.
- As this was happening on all block storage clusters simultaneously across all availability zones and the control plane, the complete platform was congested.
Fix
Short-term (during immediate resolution on 2019-03-30):
- Temporarily disable Zabbix-based monitoring agents during incident investigation.
Mid-term (implemented on 2019-04-09):
- Apply a code-patch to limit the monitoring agent resource usage for each node with the cluster group.
- Disable the function to restart monitoring agent when the CPU/memory usage reached a threshold.
- Apply a patch to do the correction and validation for returned timestamp for the cron task of the monitoring agent.
- re-enable monitoring agent for all hosts.
Long-term (scheduled for 2019-05-14):
- Apply a patch to provide the function to monitor the monitoring agent itself and generate alerts when it is abnormally.
Further improvements
Additional to the code fixes mentioned above, the OTC team has already started improvements in the following areas:
- Full scope code review to identify and remove other architectural single points of failures. To fully focus on this task, our partner Huawei has decided on a freeze of new features until end of June 2019. This is a reasonable decision which will also improve test coverage and code quality.
- Improvements on internal tooling and organization. Even though the OTC team reacted very professionally and well-coordinated during this major outage, we have identified several opportunities for improvement in our organization. One example is that we will put in place further resilience measures for internal information systems, which were partly affected by the platform outage, delaying resolution time. Also, a holistic review of our processes is on-going to achieve significantly shorter incident resolution times.
- Review of the platform nodes' time zone and NTP configuration and check of compliance against required standard.
- Implementation of general congestion avoidance measures, both, directly in the code of the service and per operating system restrictions (eg. ulimits, cgroups and/or netfilter).
Customer impact
The outage affected all services in all regions and all availability zones. The service down times are listed in the following table. Even with very professional teams and focused engineers, the analysis of the symptoms was difficult and took time, leading to an unacceptable high incident resolution time in the end. Taking into account that many Kubernetes clusters and PaaS solutions were recovered only after all OTC platform services were running again, the outage for several end-customer services took up to 24 hours. This is not acceptable and will be addressed by the OTC team.
On the positive side, we did not lose any virtual machines or any data on the storage devices due to the outage. Also, neither unintended nor unauthorized operations were performed or made possible. The integrity of the platform was and is unaffected by the outage.
| Service Name | Outage start | Outage end | duration (hh:mm) |
|---|---|---|---|
| Elastic Cloud Server | 30.03.2019 12:05 CET | 30.03.2019 20:00 CET | 07:55 |
| Image Management | 30.03.2019 12:05 CET | 30.03.2019 20:00 CET | 07:55 |
| Dedicated Host | 30.03.2019 12:05 CET | 30.03.2019 20:00 CET | 07:55 |
| Bare Metal Server | 30.03.2019 12:05 CET | 30.03.2019 20:00 CET | 07:55 |
| Auto Scaling | 30.03.2019 12:05 CET | 30.03.2019 22:00 CET | 09:55 |
| Simple Message Notification | 30.03.2019 12:05 CET | 30.03.2019 20:00 CET | 07:55 |
| Cloud Eye | 30.03.2019 12:05 CET | 30.03.2019 22:50 CET | 10:45 |
| Classic Load Balancer | 30.03.2019 12:05 CET | 30.03.2019 20:00 CET | 07:55 |
| Enhanced Load Balancer | 30.03.2019 12:05 CET | 30.03.2019 20:00 CET | 07:55 |
| Domain Name Service | 30.03.2019 12:05 CET | 31.03.2019 03:03 CEST | 14:58 |
| Virtual Private Cloud | 30.03.2019 12:05 CET | 30.03.2019 20:00 CET | 07:55 |
| Identity and Access Management | 30.03.2019 12:05 CET | 30.03.2019 20:00 CET | 07:55 |
| Key Management Service | 30.03.2019 12:05 CET | 30.03.2019 22:50 CET | 10:45 |
| Elastic Volume Service | 30.03.2019 12:05 CET | 30.03.2019 20:00 CET | 07:55 |
| Object Storage | 30.03.2019 12:05 CET | 31.03.2019 02:30 CET | 14:25 |
| Scalable File Service | 30.03.2019 12:05 CET | 30.03.2019 22:50 CET | 10:45 |
| Volume Backup Service | 30.03.2019 12:05 CET | 30.03.2019 20:00 CET | 07:55 |
| Cloud Container Engine | 30.03.2019 12:05 CET | 30.03.2019 20:00 CET | 07:55 |
| Distributed Message Service | 30.03.2019 12:05 CET | 30.03.2019 20:00 CET | 07:55 |
| Relational Database Service | 30.03.2019 12:05 CET | 30.03.2019 20:00 CET | 07:55 |
| Distributed Cache Service | 30.03.2019 12:05 CET | 30.03.2019 20:00 CET | 07:55 |
| Document Database Service | 30.03.2019 12:05 CET | 30.03.2019 20:00 CET | 07:55 |
| MapReduce Service | 30.03.2019 12:05 CET | 30.03.2019 20:00 CET | 07:55 |
| Data Warehouse Service | 30.03.2019 12:05 CET | 30.03.2019 20:00 CET | 07:55 |
| Cloud Search Service | 30.03.2019 12:05 CET | 30.03.2019 22:50 CET | 10:45 |
| Data Ingestion Service | 30.03.2019 12:05 CET | 30.03.2019 20:00 CET | 07:55 |
| Workspace | 30.03.2019 12:05 CET | 30.03.2019 22:50 CET | 10:45 |
| Tag Management Service | 30.03.2019 12:05 CET | 30.03.2019 22:50 CET | 10:45 |
| Web Application Firewall | 30.03.2019 12:05 CET | 31.03.2019 01:30 CET | 13:25 |
FAQ
Can this happen again?
No one, also not any competitor of us, can assure at 100% that such software bugs at a single point of failure do not happen and bring down the platform. However, we are absolutely confident that with the measures and the additional knowledge and understanding which we have gained, we can reduce the risk of such kind of failures and that we can reduce the impact on end-customer business to an absolute minimum. During a 2-months feature freeze until end of May 2019, where development teams will focus on improving the platform stability by eliminating all determined single points of failure, we will achieve this. At the same time organizational measures will improve incident fixing times, thus reducing impact on end-customer business.
Would another Availability Zone help?
In the specific case, neither another region, nor another availability zone would have helped, because the software bug that caused the outage occurred on a software that was rolled out on all nodes. The option, not to roll-out nodes in a standardized way would not help either, because it would mean to handle different software versions on nodes, which is very inefficient and dangerous when it comes to fixing incidents in general. Additionally, a bug like the one that hit us, could have been introduced already years ago, not being visible until now, and thus failing any sensible staged roll-out strategy. The most promising solution for comparable bugs are multiple inherent levels of control and resource restriction, measures we had already in the platform, and which we will significantly improve with what we have learned from this outage.
Acknowledgments
When the issue occurred, the T-Systems Operations team and our partner Huawei reacted quickly and with full force. The engineers involved showed an extraordinary level of dedication and endurance in investigating this issue. To make our end-customer's services available as soon as possible was always the highest priority for everyone.
The author thanks the team for the hard and extraordinary good work!
Finally, we again apologize to you, our customers and thank you for your understanding -- we are very aware that this outage severely hit your business. We share the lessons learned transparently with you. Please rest assured that your business growth and continuity remains at the core of all our efforts. We hope you continue to work with us.